Welcome to SAVoR!
SAVoR is an easy-to-use web application that allows the user to visualize RNA-seq data and other genomic annotations on RNA secondary structures. SAVoR is designed to help researchers visualize sequencing data in the context of RNA secondary structures. You will find SAVoR useful if:
- you want to see the distribution of smRNA-seq reads along a microRNA precursor
- you want to see how a set of SNPs might impact RNA structure
- you have data from control vs. treatment sequencing experiments and would like to see regions of enrichment along an RNA structure
SAVoR has the following features:
- Directly retrieve read alignments from web-accessible BAM files
- Compute four per-nucleotide scores from read alignments:
-
- Read abundance
- Endpoint frequency
- Log-ratio of abundance from two RNA-seq experiments
- Frequency of sequence variants (read mismatches)
- Accept custom genomic annotations in the UCSC BED file format
- Predict RNA secondary structure using multiple methods, or use existing Rfam consensus structures
To get started, click on the 'User Input' tab, or click here for a sample input.
User input
Enter your sequence (as an Rfam ID, Refseq/SGD/TAIR ID, nucleotide sequence, or genomic coordinates):
Reference Genome:
Select a structure prediction method:
A consensus secondary structure from Rfam will be used.
Enter your custom secondary structure in dot-paren notation below:
RNAfold will be used to predict the secondary structure.
RNAfold with constraints dictated by the log-ratio annotation values will be used to predict the secondary structure.
Gallery
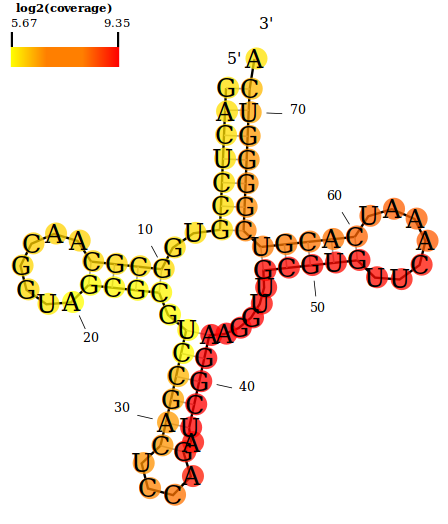
An example showing the double-stranded RNA (dsRNA) read coverage along a tRNA from D. melanogaster (FlyBase ID: FBtr0071626). The orange-red color scheme is used here.
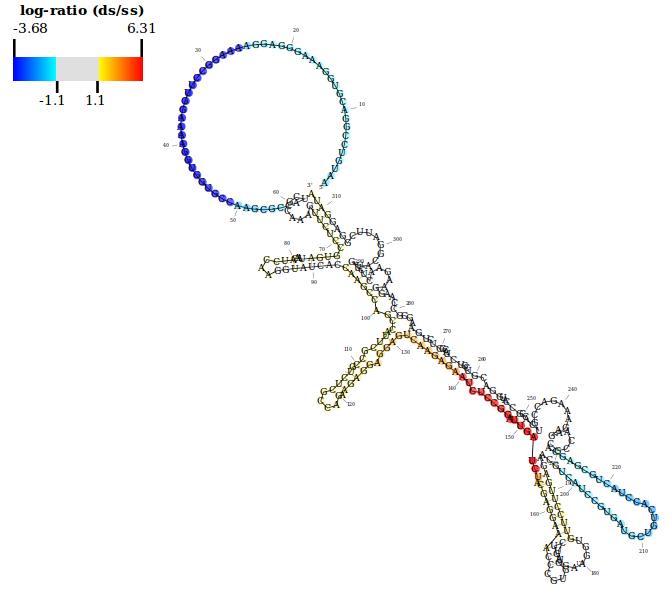
An example showing the structure score (log-ratio of dsRNA-seq to ssRNA-seq read coverage) along the protein-coding F54E12.3 transcript in C. elegans. The blue-red color scheme is used here with default thresholds.
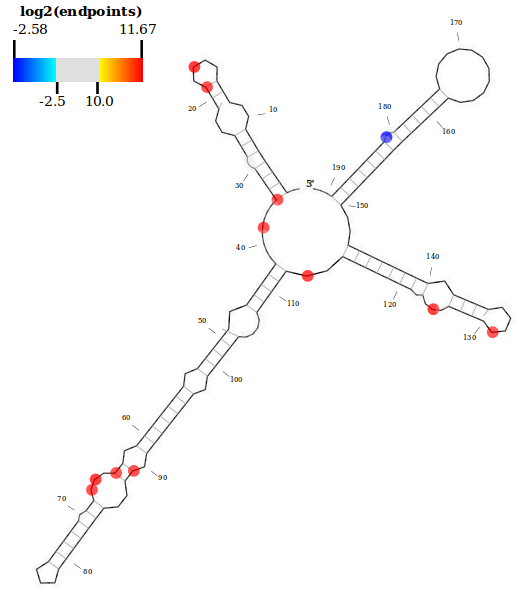
An example showing the dsRNA endpoint abundance along a U2 snRNA from D. melanogaster (FlyBase ID: FBtr0074208). Note that the nucleotide sequence is suppressed here to better visualize the distribution of endpoint annotations along the secondary structure.
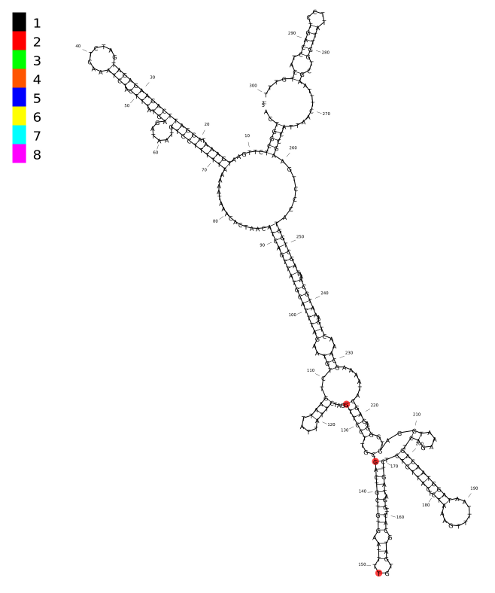
An example showing 3 SNPs from a 300bp region of intron 1 of the FTO gene (chr16:53820377-53820676). The discrete color scheme is selected here, although only annotation value '2' is used. The custom BED file used to annotate these SNPs can be downloaded here.
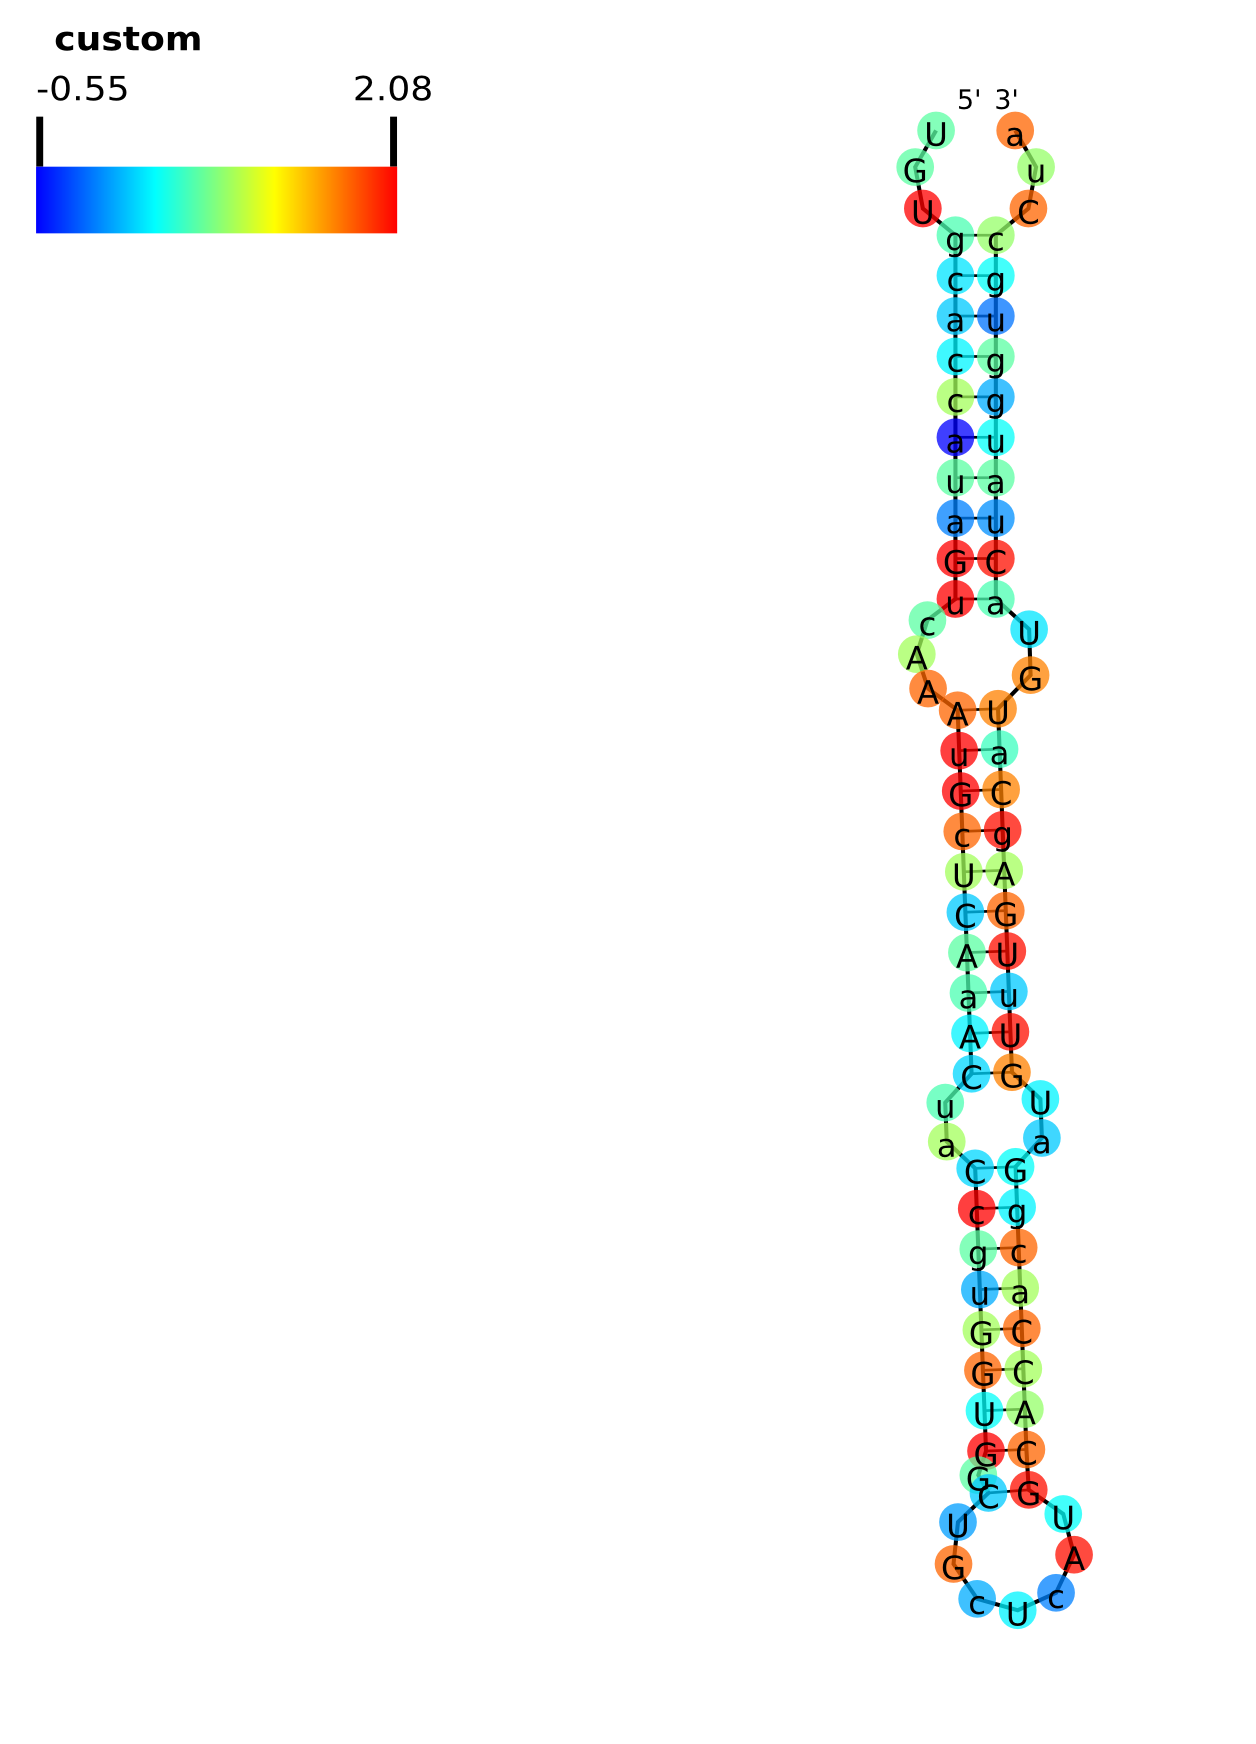
An example showing the conservation (phyloP46wayAll) score along mir-105. The custom BED file used to annotate the conservation scores can be downloaded here.
Help topics
SAVoR generates high-quality secondary structure models with various sequencing-oriented annotation options such as read coverage, endpoint locations, and SNP calls. Simply input your sequence of interest (in a variety of formats) and click "Generate". By default, SVG, PDF, and PNG files containing your structure model will be produced as output. There are many structure prediction, annotation, and visualization options that can be specified.

Four input types are currently supported:
Rfam ID (e.g. RF00004): Retrieves the sequence with the given Rfam [1] ID. If multiple genomic loci are returned (common among duplicated RNAs such as tRNAs), the user is prompted to select the desired locus before proceeding. Check out the Rfam homepage for more information.
RefSeq/SGD/TAIR ID (e.g. NM_153714 (RefSeq), YAL069W (SGD), AT1G01010.1 (TAIR)): Retrieves the sequence with the given accession ID and reference genome. RefSeq IDs are used for human, mouse, C. elegans, and D. melanogaster transcripts. Yeast transcripts can be retrieved using accession IDs from the Saccharomyces Genome Database (SGD), and A. thaliana transcripts can be retrieved using accession IDs from TAIR.
Nucleotide sequence: Directly uses the provided nucleotide sequence (also accepts FASTA format). If the user also specifies annotation options, then BLAST (using default 'blastn' settings and not allowing gaps) will be used to determine the genomic locus of the input sequence. The user will be prompted to select the desired locus among the BLAST results.
Genomic coordinates: Specified in standard UCSC format (e.g. chr17:5000-5500) and assumes plus strand, or extended UCSC format with strand information (e.g. chr17:5000-5500(-)). Additionally, multiple ranges can be specified using a comma-separated format (e.g. chr17:5000-5500,6000-6100 would specify the concatencation of [5000,5500] and [6000,6100] on the plus strand of chr17).
The specified reference genome will be used (if necessary) to extract sequence and annotation values.
Four input types are currently supported:
Rfam: Directly uses the specified Rfam structure. Note that this option is valid only if an Rfam ID is used as sequence input, and will return an error in all other cases.
RNAfold: Uses the Vienna package's RNAfold [2] algorithm to predict a secondary structure.
Custom: Directly uses the specified secondary structure in dot-paren format.
Constrained: Uses log-ratio data (see annotation options below) constraints and the Vienna package's RNAfold algorithm to predict a secondary structure. This approach is generally only useful if you have the specific type of sequencing-based structure data generated here [3].
By default, no annotation is performed and the output SVG contains only the structure backbone and sequence. However, it is highly recommended that the user specify an annotation option - this is indeed the entire service of our web server! The various options are described below:
Coverage: Shows the log2 per-base read coverage as a heatscale over the structure. This option requires the user to specify the location of a web-accessible BAM file of read alignments.
Endpoints: Shows the log2 per-base endpoint coverage as a heatscale over the structure. Endpoints refer to the 5' and 3' ends of sequencing reads. This option requires the user to specify the location of a web-accessible BAM file of read alignments.
Log-ratio: Shows the per-base normalized log-ratio described here[3]. This option requires the user to specify the location of two web-accessible BAM files of read alignments that represent the numerator and denominator in the structure score calculation, respectively.
Mismatch: Shows the per-base mismatch count. This option requires the user to specify the location of a web-accessible BAM file of read alignments.
BED format: Allows the user to directly upload any custom annotation in tab-delimited BED format. This option can be used to specify SNP calls, read quality scores, conservation scores, or anything else that the user desires. The coordinates contained in the BED file can be interpreted in two ways: relative to this transcript, such that position 0 is the first nucleotide of the provided transcript (chromosome and strand are ignored), or relative to the genome, where the coordinates are assumed to be genomic.
Direct entry: Allows the user to directly enter custom annotation values.
Display nucleotide sequence: Includes the nucleotide sequence in the structure model.
Include mile markers: Adds markers to every tenth nucleotide in the structure.
Include zoom tools: Includes header scripts in the SVG output file that allow the user to zoom, scale, and rotate the structure model.
Include sequence ID: Includes the sequence input (as genomic coordinates or Rfam/RefSeq/SGD/TAIR IDs) in the output file. If a nucleotide sequence is given as input, then up to the first 50 nucleotides are included.
Color scheme: Specifies the color scheme to be used for annotations. The discrete color scheme uses eight fixed colors to represent the specific integer annotation values [1,2,3,4,5,6,7,8]. This is designed primarily for use with BED format annotations where the 'score' column is used as the annotation value, and allows the user to apply a fixed color palette to indicate positions of interest along a structure model. The exact color palette is shown below:
Thresholds: Specifies cutoffs for coloring of annotation values. The bottom half (e.g. 'blue' in a blue-red color scheme) is used for annotation values below the 'min' threshold, and the top half (e.g. 'red' in a blue-red color scheme) is used for values above the 'max' threshold. Intermediate values are colored in grey. This is particularly useful for log-ratio type data, where one might want to visualize "negative" and "positive" information.
Fade translucency: Scales annotation opacity.
Custom annotation label: [Optional] Specifies the label to be printed above the color scale bar.
SAVoR currently supports Rfam and RefSeq/SGD/TAIR entries from the following genomes:
- human (hg19)
- mouse (mm9)
- C. elegans (ce6)
- D. melanogaster (dm3)
- S. cerevisiae (sacCer3)
- A. thaliana (TAIR10)
Output from the SAVoR web server consists of a secondary structure model with the selected annotation overlay and visualization options, rendered in SVG, PDF, and PNG formats. The files generated by each submission to SAVoR are unique to that instance and cannot be accessed by other users. All results will be kept on our server for a minimum of 72 hours.
1. I have annotation data in BED format (e.g. SNP calls) that I want to show in discrete colors on a structure model. How can I do this?
For now, the best way to accomplish this is to fill out the 'score' field of your BED file to contain discrete integer values ranging from 1 to 8. Then select the 'discrete' color scheme option. We are currently working on a better way for users to specify custom colors. Check back soon to see if this feature has been implemented!
2. What browsers and operating systems are supported?
SAVoR is compatible with most major web browsers including Microsoft Internet Explorer (7 and up), Firefox (3.5 and up), Chrome (14.0 and up), and Safari (5.1.2 and up). As SAVoR is completely web-based, all Microsoft Windows, Mac OS, and Unix operating systems are compatible.
3. I'd like to view data from my favorite model organism, but it is not supported by SAVoR! What should I do?
SAVoR is constantly being enhanced and expanded; however, our development team is small and we have to set a priority on all features we plan to implement. Please send us an email (savor@pcbi.upenn.edu) to report bugs, suggest particular features, or see a new model organism being supported by SAVoR. This information will help us better prioritize new features.
4. How can I generate a BED file to upload my custom annotations?
There are many ways to create a BED format file, the simplest of which is to use a text editor and write it manually. However, often one may want to use existing data such as UCSC annotation tracks. The following steps will walk through creation of a BED format file containing conservation scores for microRNA mir-105:
Extract data from UCSC Table Browser - Fill in the fields as below:

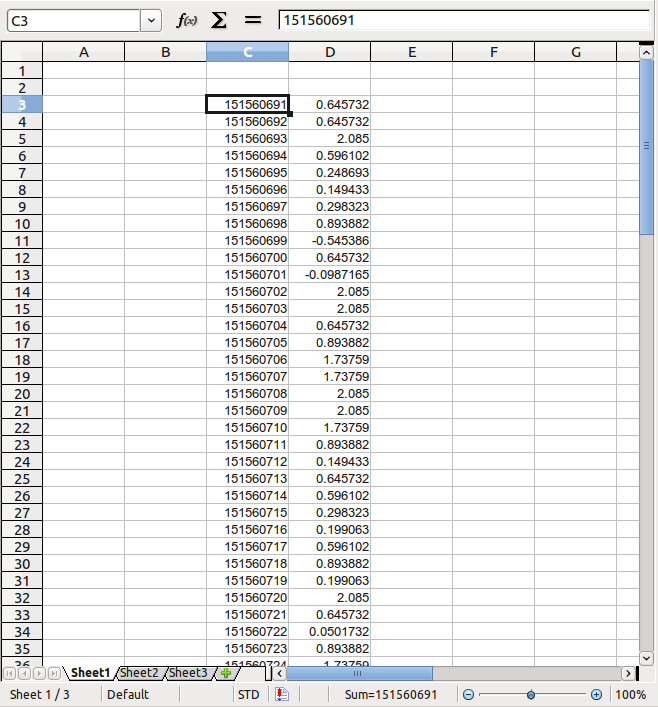
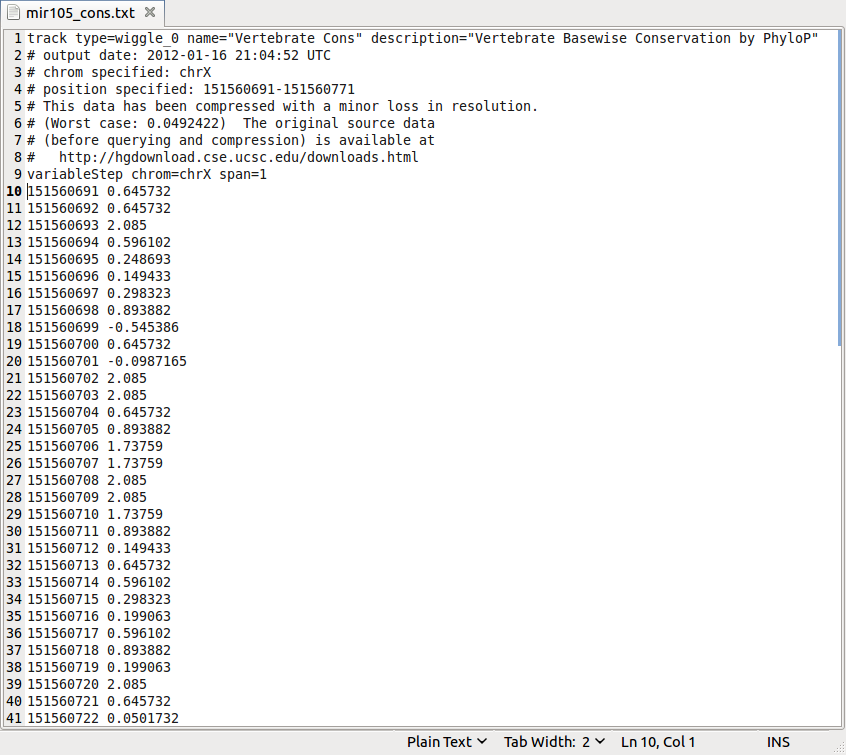
Save the target file 'mir105_cons.txt' to any location on your computer.Get the data values from 'mir105_cons.txt' (from line 10 down in the example here):
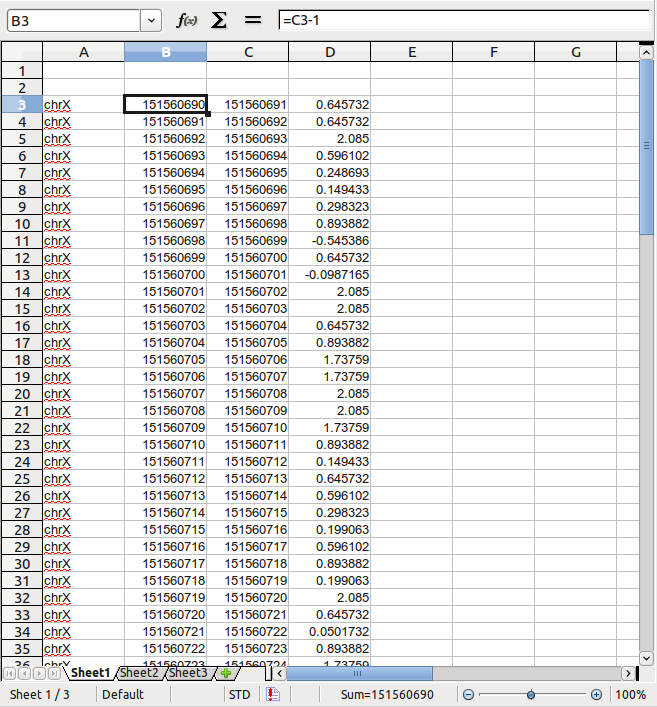
Insert a column for data source, AFTER the end position but BEFORE the conservation score:
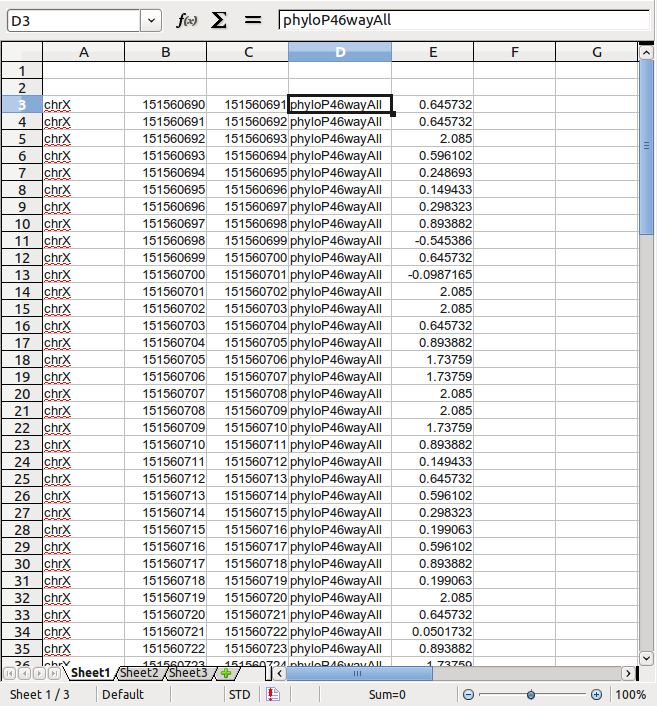
Now you can directly copy the data from your spreadsheet into any text editor to get a tab-delimited BED file.
If you find SAVoR useful in your work, please cite the following publication:
- F. Li, P. Ryvkin, D.M. Childress, O. Valladares, B.D. Gregory, L.S. Wang. "SAVoR: a server for sequencing annotation and visualization of RNA structures". Nucleic Acids Research (2012 Web Server issue), doi: 10.1093/nar/gks310 [link]
SAVoR also utilizes the following software packages (credit to their authors):
- RNAfold/RNAplot [2] - Used to predict RNA secondary structures and layout of the backbone.
- SAMtools [4] - Used to extract reads from BAM files.
- NCBI BLAST+ applications [5] - Used to extract nucleotide sequences from genomic coordinates.
- Inkscape (http://www.inkscape.org) - Used to convert to PDF and PNG formats.
References
Inputs not defined.
Currently, we only support a tab-delimited file of the format id,sequence,structure,annotation_values.
The annotation values should be comma-separated. Each line of the tab-delimited file should correspond to a single model to be plotted.
Click 'Browse' below to select a file to upload, then click 'Upload'.
 Annotation Options
Select annotation type:
You have selected coverage annotation. This shows the log2 per-base read coverage.
Please supply read alignments as a web accessible BAM file.
You have selected endpoints annotation. This shows the log2 per-base endpoint coverage, where endpoints refer to the 5' and 3' ends of reads.
Please supply read alignments as a web accessible BAM file.
You have selected mismatch annotation. This shows the raw per-base mismatch count.
Please supply read alignments as a web accessible BAM file.
BAM file URL:
You have selected log-ratio annotation. This shows the per-base normalized log-ratio of read abundances between the two specified experiments.
Please supply numerator and denominator alignments as web accessible BAM files.
Numerator BAM file URL:
Denominator BAM file URL:
You have selected BED format annotation.
Please upload a file in BED format:
BED file coordinates are:
relative to the genome
relative to this transcript
You have selected direct input annotation.
Please enter your annotation values below:
 Visualization Options
Display nucleotide sequence
Mark 5' and 3' ends
Include mile markers
Include zoom tools
Include sequence ID
Fade translucency
Custom annotation label
Color scheme options:
Color scheme: Thresholds: min max
